Facts and figures 2013 – Immigration overview: Permanent residents
| Source country | 2004 | 2005 | 2006 | 2007 | 2008 | 2009 | 2010 | 2011 | 2012 | 2013 |
|---|---|---|---|---|---|---|---|---|---|---|
|
|
||||||||||
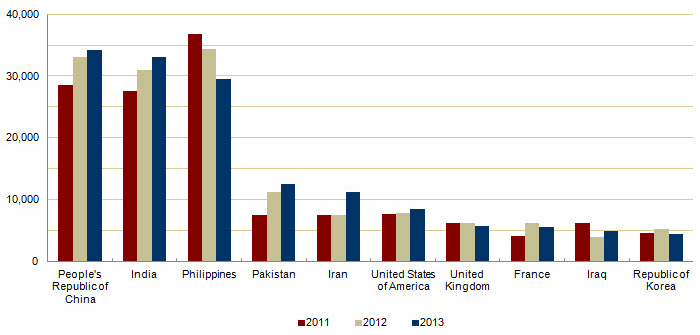
| People’s Republic of China | 36,620 | 42,584 | 33,518 | 27,642 | 30,037 | 29,622 | 30,391 | 28,503 | 33,024 | 34,126 |
|
|
||||||||||
| India | 28,235 | 36,210 | 33,847 | 28,742 | 28,261 | 29,457 | 34,235 | 27,509 | 30,932 | 33,085 |
|
|
||||||||||
| Philippines | 14,004 | 18,139 | 18,400 | 19,837 | 24,888 | 28,573 | 38,617 | 36,765 | 34,314 | 29,539 |
|
|
||||||||||
| Pakistan | 13,399 | 14,314 | 13,127 | 10,124 | 8,994 | 7,217 | 6,811 | 7,468 | 11,227 | 12,602 |
|
|
||||||||||
| Iran | 6,348 | 5,837 | 7,480 | 6,974 | 6,475 | 6,580 | 7,477 | 7,479 | 7,533 | 11,291 |
|
|
||||||||||
| United States of America | 6,990 | 8,394 | 9,613 | 9,463 | 10,190 | 8,995 | 8,142 | 7,675 | 7,891 | 8,495 |
|
|
||||||||||
| United Kingdom and Colonies | 7,533 | 7,258 | 7,140 | 8,216 | 8,979 | 8,876 | 8,724 | 6,204 | 6,195 | 5,826 |
|
|
||||||||||
| France | 4,391 | 4,429 | 4,002 | 4,290 | 4,532 | 5,051 | 4,646 | 4,080 | 6,280 | 5,624 |
|
|
||||||||||
| Iraq | 1,796 | 2,226 | 1,788 | 2,406 | 3,543 | 5,450 | 5,941 | 6,196 | 4,041 | 4,918 |
|
|
||||||||||
| Republic of Korea | 5,352 | 5,832 | 6,215 | 5,920 | 7,294 | 5,874 | 5,537 | 4,589 | 5,315 | 4,509 |
|
|
||||||||||
| Algeria | 3,616 | 3,626 | 4,807 | 3,623 | 4,005 | 5,393 | 4,752 | 4,325 | 3,774 | 4,331 |
|
|
||||||||||
| Nigeria | 1,518 | 2,236 | 2,594 | 2,375 | 2,109 | 3,156 | 3,906 | 3,103 | 3,443 | 4,173 |
|
|
||||||||||
| Egypt | 2,393 | 2,496 | 2,190 | 2,356 | 3,347 | 3,496 | 5,982 | 4,663 | 5,555 | 4,164 |
|
|
||||||||||
| Haiti | 1,652 | 1,682 | 1,619 | 1,598 | 2,491 | 2,080 | 4,744 | 6,504 | 5,868 | 4,143 |
|
|
||||||||||
| Mexico | 2,259 | 2,837 | 2,844 | 3,239 | 2,856 | 3,092 | 3,865 | 3,948 | 4,227 | 3,996 |
|
|
||||||||||
| Bangladesh | 2,660 | 4,171 | 4,014 | 2,897 | 2,939 | 2,104 | 4,721 | 2,694 | 2,640 | 3,789 |
|
|
||||||||||
| Colombia | 4,566 | 6,424 | 6,535 | 5,357 | 5,452 | 4,652 | 5,218 | 4,366 | 3,739 | 3,632 |
|
|
||||||||||
| Morocco | 3,686 | 2,939 | 3,322 | 4,021 | 4,226 | 5,532 | 6,242 | 4,399 | 3,876 | 3,259 |
|
|
||||||||||
| Ukraine | 2,431 | 2,270 | 1,973 | 2,218 | 1,937 | 2,367 | 3,159 | 2,516 | 2,265 | 2,487 |
|
|
||||||||||
| Jamaica | 2,237 | 1,945 | 1,722 | 2,141 | 2,334 | 2,456 | 2,321 | 2,059 | 2,182 | 2,477 |
|
|
||||||||||
| Russia | 3,989 | 3,972 | 3,117 | 2,983 | 2,690 | 2,931 | 2,288 | 1,963 | 2,079 | 2,466 |
|
|
||||||||||
| Federal Republic of Cameroon | 436 | 604 | 697 | 1,025 | 1,279 | 1,344 | 1,800 | 1,638 | 2,507 | 2,439 |
|
|
||||||||||
| Sri Lanka | 4,495 | 4,930 | 4,714 | 4,123 | 4,756 | 4,547 | 4,422 | 3,309 | 3,338 | 2,395 |
|
|
||||||||||
| Lebanon | 3,293 | 3,709 | 3,802 | 3,467 | 3,566 | 3,077 | 3,432 | 3,072 | 1,614 | 2,172 |
|
|
||||||||||
| Socialist Republic of Vietnam | 1,816 | 1,852 | 3,153 | 2,574 | 1,784 | 2,171 | 1,942 | 1,723 | 1,731 | 2,112 |
|
|
||||||||||
| Democratic Republic of Congo | 1,465 | 1,521 | 1,623 | 1,466 | 1,397 | 1,581 | 1,239 | 1,224 | 1,714 | 2,050 |
|
|
||||||||||
| Democratic Republic of Somalia | 1,364 | 1,198 | 1,061 | 1,166 | 1,015 | 1,214 | 1,528 | 1,535 | 1,582 | 2,028 |
|
|
||||||||||
| Afghanistan | 2,978 | 3,436 | 3,009 | 2,652 | 2,111 | 1,746 | 1,758 | 2,203 | 2,635 | 2,004 |
|
|
||||||||||
| Israel | 2,788 | 2,446 | 2,625 | 2,401 | 2,562 | 2,316 | 2,755 | 1,970 | 2,134 | 1,945 |
|
|
||||||||||
| Eritrea | 414 | 528 | 700 | 699 | 799 | 904 | 931 | 1,182 | 1,335 | 1,718 |
|
|
||||||||||
| Brazil | 917 | 969 | 1,181 | 1,746 | 2,138 | 2,509 | 2,598 | 1,508 | 1,642 | 1,712 |
|
|
||||||||||
| Tunisia | 764 | 756 | 1,065 | 869 | 950 | 1,195 | 1,299 | 1,442 | 1,503 | 1,627 |
|
|
||||||||||
| Ethiopia | 1,535 | 1,506 | 1,801 | 1,512 | 1,613 | 1,289 | 1,865 | 2,163 | 1,864 | 1,605 |
|
|
||||||||||
| Romania | 5,755 | 5,048 | 4,468 | 3,834 | 2,837 | 2,076 | 1,922 | 1,776 | 1,588 | 1,512 |
|
|
||||||||||
| Cuba | 866 | 999 | 1,064 | 1,350 | 1,300 | 1,433 | 961 | 962 | 1,304 | 1,402 |
|
|
||||||||||
| Nepal | 404 | 607 | 540 | 511 | 581 | 561 | 1,392 | 1,129 | 1,185 | 1,308 |
|
|
||||||||||
| Jordan | 1,733 | 1,940 | 1,827 | 1,421 | 1,581 | 1,235 | 1,831 | 1,635 | 1,206 | 1,255 |
|
|
||||||||||
| Republic of South Africa | 1,175 | 988 | 1,111 | 1,200 | 1,123 | 1,188 | 1,238 | 959 | 1,243 | 1,240 |
|
|
||||||||||
| Moldova | 628 | 655 | 803 | 1,099 | 1,127 | 1,535 | 1,988 | 1,367 | 1,416 | 1,231 |
|
|
||||||||||
| Federal Republic of Germany | 2,020 | 2,226 | 2,767 | 2,449 | 3,833 | 3,887 | 2,956 | 2,053 | 1,702 | 1,217 |
|
|
||||||||||
| Mauritius | 702 | 696 | 512 | 507 | 714 | 872 | 1,455 | 1,146 | 799 | 1,203 |
|
|
||||||||||
| Republic of Ivory Coast | 256 | 294 | 431 | 619 | 646 | 668 | 1,066 | 636 | 1,024 | 1,170 |
|
|
||||||||||
| Australia | 930 | 909 | 875 | 1,033 | 1,018 | 1,018 | 933 | 851 | 982 | 1,121 |
|
|
||||||||||
| Venezuela | 1,224 | 1,211 | 1,192 | 1,335 | 1,239 | 1,353 | 998 | 1,452 | 1,373 | 1,022 |
|
|
||||||||||
| Republic of Ireland | 244 | 224 | 283 | 300 | 412 | 395 | 548 | 525 | 725 | 1,015 |
|
|
||||||||||
| Syria | 1,116 | 1,458 | 1,145 | 1,056 | 919 | 917 | 1,039 | 1,004 | 650 | 1,009 |
|
|
||||||||||
| Japan | 973 | 1,067 | 1,212 | 1,250 | 1,284 | 1,194 | 1,168 | 1,265 | 1,214 | 982 |
|
|
||||||||||
| Poland | 1,533 | 1,405 | 1,263 | 1,235 | 1,267 | 1,013 | 795 | 720 | 779 | 851 |
|
|
||||||||||
| Senegal | 210 | 278 | 416 | 433 | 555 | 668 | 765 | 740 | 949 | 818 |
|
|
||||||||||
| Hong Kong | 536 | 729 | 712 | 674 | 897 | 657 | 623 | 591 | 728 | 774 |
|
|
||||||||||
| Taiwan | 2,012 | 3,097 | 2,818 | 2,766 | 2,993 | 2,472 | 2,629 | 1,704 | 985 | 773 |
|
|
||||||||||
| Turkey | 1,736 | 2,065 | 1,638 | 1,463 | 1,122 | 1,238 | 1,492 | 1,257 | 1,068 | 729 |
|
|
||||||||||
| Peru | 1,460 | 1,653 | 1,473 | 1,490 | 1,094 | 1,884 | 1,283 | 886 | 787 | 682 |
|
|
||||||||||
| Kenya | 685 | 693 | 622 | 449 | 453 | 489 | 507 | 585 | 725 | 664 |
|
|
||||||||||
| Guyana | 1,341 | 1,215 | 1,286 | 1,277 | 1,137 | 1,181 | 953 | 804 | 676 | 656 |
|
|
||||||||||
| El Salvador | 442 | 436 | 430 | 929 | 1,115 | 845 | 787 | 690 | 641 | 639 |
|
|
||||||||||
| Portugal | 336 | 338 | 424 | 405 | 665 | 623 | 629 | 528 | 560 | 629 |
|
|
||||||||||
| Albania | 1,450 | 1,223 | 856 | 702 | 560 | 716 | 561 | 539 | 620 | 603 |
|
|
||||||||||
| Dominican Republic | 270 | 303 | 294 | 311 | 438 | 391 | 479 | 739 | 604 | 589 |
|
|
||||||||||
| Italy | 334 | 344 | 325 | 320 | 370 | 429 | 434 | 374 | 440 | 545 |
|
|
||||||||||
| St. Vincent and the Grenadines | 294 | 343 | 383 | 579 | 434 | 511 | 434 | 451 | 523 | 538 |
|
|
||||||||||
| Ghana | 738 | 851 | 710 | 688 | 629 | 659 | 802 | 528 | 531 | 517 |
|
|
||||||||||
| Bulgaria | 2,022 | 1,738 | 1,419 | 1,172 | 994 | 784 | 556 | 365 | 451 | 512 |
|
|
||||||||||
| Bhutan | — | 5 | 10 | — | 36 | 865 | 1,464 | 1,879 | 1,075 | 487 |
|
|
||||||||||
| Burundi | 559 | 626 | 468 | 614 | 448 | 566 | 529 | 604 | 684 | 477 |
|
|
||||||||||
| Republic of Guinea | 281 | 256 | 342 | 415 | 327 | 347 | 395 | 352 | 407 | 463 |
|
|
||||||||||
| Palestinian Authority (Gaza/West Bank) | 376 | 453 | 627 | 441 | 481 | 400 | 654 | 555 | 533 | 462 |
|
|
||||||||||
| Stateless | 921 | 842 | 845 | 656 | 622 | 542 | 701 | 563 | 487 | 458 |
|
|
||||||||||
| Republic of Trinidad & Tobago | 730 | 857 | 794 | 975 | 1,002 | 1,134 | 915 | 588 | 586 | 427 |
|
|
||||||||||
| Hungary | 671 | 516 | 520 | 425 | 383 | 312 | 354 | 287 | 300 | 424 |
|
|
||||||||||
| Ecuador | 417 | 491 | 525 | 419 | 437 | 373 | 353 | 348 | 282 | 418 |
|
|
||||||||||
| New Zealand | 350 | 370 | 318 | 350 | 480 | 520 | 490 | 375 | 417 | 414 |
|
|
||||||||||
| Rwanda | 299 | 378 | 360 | 420 | 358 | 415 | 396 | 492 | 562 | 409 |
|
|
||||||||||
| Zimbabwe | 1,450 | 615 | 454 | 663 | 611 | 508 | 494 | 434 | 437 | 407 |
|
|
||||||||||
| Thailand | 392 | 575 | 500 | 487 | 519 | 512 | 499 | 396 | 296 | 400 |
|
|
||||||||||
| Peoples Republic of Benin | 112 | 95 | 116 | 183 | 205 | 238 | 290 | 284 | 391 | 397 |
|
|
||||||||||
| The Netherlands | 749 | 813 | 837 | 615 | 818 | 786 | 759 | 586 | 504 | 395 |
|
|
||||||||||
| St. Lucia | 110 | 185 | 190 | 255 | 298 | 257 | 249 | 261 | 382 | 390 |
|
|
||||||||||
| Republic of Indonesia | 552 | 632 | 613 | 657 | 661 | 504 | 712 | 390 | 395 | 386 |
|
|
||||||||||
| Belgium | 411 | 400 | 302 | 363 | 335 | 358 | 363 | 332 | 402 | 379 |
|
|
||||||||||
| Honduras | 133 | 166 | 164 | 165 | 187 | 169 | 386 | 538 | 436 | 350 |
|
|
||||||||||
| Kazakhstan | 545 | 506 | 408 | 436 | 394 | 431 | 377 | 381 | 462 | 348 |
|
|
||||||||||
| Guatemala | 217 | 190 | 230 | 258 | 263 | 264 | 266 | 288 | 358 | 345 |
|
|
||||||||||
| Democratic Republic of Sudan | 1,823 | 1,310 | 1,039 | 683 | 622 | 422 | 612 | 531 | 444 | 340 |
|
|
||||||||||
| Spain | 133 | 126 | 124 | 137 | 169 | 195 | 174 | 179 | 262 | 331 |
|
|
||||||||||
| Burkina Faso | 97 | 91 | 147 | 136 | 139 | 162 | 186 | 144 | 269 | 322 |
|
|
||||||||||
| Republic of Togo | 163 | 157 | 149 | 235 | 351 | 400 | 354 | 261 | 299 | 315 |
|
|
||||||||||
| Greece | 120 | 100 | 74 | 110 | 107 | 119 | 101 | 102 | 146 | 298 |
|
|
||||||||||
| Republic of Serbia | — | 50 | 259 | 365 | 267 | 299 | 395 | 297 | ||
|
|
||||||||||
| Cambodia | 348 | 370 | 529 | 460 | 354 | 203 | 200 | 196 | 233 | 288 |
|
|
||||||||||
| Argentina | 1,591 | 1,153 | 847 | 620 | 540 | 467 | 459 | 278 | 263 | 282 |
|
|
||||||||||
| Chile | 383 | 384 | 427 | 530 | 350 | 375 | 340 | 174 | 291 | 273 |
|
|
||||||||||
| Saudi Arabia | 128 | 198 | 252 | 188 | 249 | 246 | 330 | 278 | 286 | 267 |
|
|
||||||||||
| Myanmar (Burma) | 191 | 210 | 953 | 1,887 | 975 | 1,153 | 556 | 368 | 193 | 262 |
|
|
||||||||||
| Libya | 196 | 196 | 281 | 198 | 306 | 282 | 384 | 352 | 299 | 255 |
|
|
||||||||||
| Belarus | 543 | 558 | 439 | 568 | 524 | 454 | 438 | 357 | 277 | 247 |
|
|
||||||||||
| Madagascar | 79 | 88 | 96 | 115 | 118 | 169 | 178 | 148 | 165 | 229 |
|
|
||||||||||
| Fiji | 495 | 298 | 277 | 304 | 321 | 311 | 398 | 316 | 270 | 228 |
|
|
||||||||||
| Republic of Yemen | 124 | 161 | 140 | 122 | 133 | 128 | 211 | 160 | 174 | 217 |
|
|
||||||||||
| Latvia | 94 | 77 | 69 | 88 | 67 | 85 | 70 | 103 | 202 | 213 |
|
|
||||||||||
| Armenia | 147 | 224 | 218 | 198 | 205 | 267 | 252 | 236 | 258 | 207 |
|
|
||||||||||
| Uganda | 160 | 239 | 201 | 170 | 204 | 185 | 216 | 213 | 222 | 206 |
|
|
||||||||||
| Malaysia | 401 | 593 | 580 | 600 | 658 | 640 | 802 | 409 | 358 | 204 |
|
|
||||||||||
| Switzerland | 337 | 270 | 258 | 308 | 357 | 328 | 285 | 266 | 243 | 201 |
|
|
||||||||||
| Republic of Djibouti | 67 | 93 | 68 | 50 | 47 | 70 | 123 | 127 | 164 | 194 |
|
|
||||||||||
| Republic of Mali | 87 | 87 | 114 | 143 | 154 | 164 | 170 | 155 | 191 | 190 |
|
|
||||||||||
| United Republic of Tanzania | 310 | 274 | 291 | 195 | 230 | 136 | 200 | 215 | 224 | 182 |
|
|
||||||||||
| Czech Republic | 191 | 193 | 146 | 137 | 104 | 159 | 168 | 128 | 173 | 173 |
|
|
||||||||||
| Republic of Kosovo | 6 | 113 | 233 | 215 | 152 | 171 | ||||
|
|
||||||||||
| Grenada | 296 | 283 | 363 | 360 | 284 | 325 | 208 | 173 | 142 | 170 |
|
|
||||||||||
| Central Africa Republic | 13 | 49 | 18 | 30 | 28 | 19 | 26 | 18 | 45 | 169 |
|
|
||||||||||
| Uzbekistan | 175 | 330 | 262 | 284 | 215 | 288 | 289 | 162 | 235 | 167 |
|
|
||||||||||
| Lithuania | 220 | 167 | 113 | 108 | 109 | 63 | 57 | 52 | 77 | 145 |
|
|
||||||||||
| Singapore | 311 | 392 | 298 | 690 | 734 | 366 | 805 | 219 | 146 | 141 |
|
|
||||||||||
| Sweden | 129 | 205 | 139 | 193 | 165 | 167 | 159 | 134 | 140 | 140 |
|
|
||||||||||
| Croatia | 151 | 128 | 102 | 102 | 131 | 92 | 91 | 135 | 112 | 125 |
|
|
||||||||||
| Georgia | 106 | 114 | 125 | 132 | 112 | 128 | 126 | 139 | 147 | 125 |
|
|
||||||||||
| Kyrgyzstan | 245 | 173 | 161 | 135 | 168 | 173 | 157 | 159 | 278 | 123 |
|
|
||||||||||
| Costa Rica | 165 | 188 | 279 | 281 | 246 | 217 | 190 | 149 | 183 | 122 |
|
|
||||||||||
| Bosnia-Herzegovina | 188 | 211 | 217 | 209 | 182 | 156 | 168 | 140 | 121 | 119 |
|
|
||||||||||
| People’s Republic of the Congo | 142 | 136 | 143 | 87 | 72 | 70 | 75 | 81 | 91 | 114 |
|
|
||||||||||
| Macedonia | 443 | 285 | 256 | 211 | 191 | 198 | 188 | 130 | 126 | 112 |
|
|
||||||||||
| Bolivia | 85 | 134 | 139 | 107 | 143 | 214 | 180 | 86 | 83 | 107 |
|
|
||||||||||
| Republic of the Niger | 38 | 59 | 57 | 75 | 75 | 82 | 80 | 90 | 95 | 105 |
|
|
||||||||||
| Slovak Republic | 597 | 369 | 241 | 215 | 125 | 128 | 135 | 134 | 136 | 105 |
|
|
||||||||||
| People’s Republic of Mongolia | 34 | 59 | 64 | 82 | 59 | 118 | 169 | 103 | 68 | 99 |
|
|
||||||||||
| Barbados | 90 | 111 | 97 | 130 | 134 | 125 | 121 | 97 | 132 | 97 |
|
|
||||||||||
| Nicaragua | 67 | 79 | 96 | 76 | 124 | 116 | 94 | 123 | 106 | 96 |
|
|
||||||||||
| Austria | 118 | 122 | 102 | 98 | 91 | 109 | 124 | 84 | 102 | 90 |
|
|
||||||||||
| Gabon Republic | 33 | 67 | 68 | 101 | 86 | 86 | 64 | 63 | 74 | 90 |
|
|
||||||||||
| Republic of Chad | 92 | 126 | 96 | 131 | 95 | 87 | 98 | 79 | 97 | 86 |
|
|
||||||||||
| Namibia | 9 | 6 | 19 | 13 | 26 | 14 | 16 | 23 | 24 | 82 |
|
|
||||||||||
| Denmark | 89 | 62 | 101 | 97 | 108 | 81 | 92 | 93 | 94 | 81 |
|
|
||||||||||
| Republic of Botswana | 9 | 7 | 11 | 8 | 28 | 15 | 42 | 53 | 64 | 76 |
|
|
||||||||||
| Finland | 54 | 67 | 51 | 62 | 89 | 63 | 63 | 72 | 62 | 76 |
|
|
||||||||||
| Iceland | 23 | 10 | — | 15 | 13 | 15 | 30 | 38 | 42 | 72 |
|
|
||||||||||
| Paraguay | 74 | 75 | 88 | 98 | 95 | 88 | 89 | 83 | 55 | 66 |
|
|
||||||||||
| Sierra Leone | 347 | 191 | 138 | 92 | 103 | 70 | 63 | 96 | 72 | 61 |
|
|
||||||||||
| Norway | 73 | 57 | 53 | 73 | 66 | 75 | 46 | 49 | 53 | 59 |
|
|
||||||||||
| Zambia | 56 | 91 | 77 | 71 | 64 | 60 | 102 | 69 | 46 | 59 |
|
|
||||||||||
| Uruguay | 130 | 217 | 175 | 147 | 160 | 99 | 93 | 81 | 47 | 58 |
|
|
||||||||||
| Azerbaijan | 230 | 359 | 236 | 203 | 125 | 165 | 209 | 138 | 161 | 57 |
|
|
||||||||||
| Mauritania | 60 | 86 | 124 | 96 | 112 | 83 | 74 | 54 | 77 | 57 |
|
|
||||||||||
| The Bahama Islands | 13 | 14 | 18 | 23 | 30 | 27 | 25 | 40 | 60 | 55 |
|
|
||||||||||
| Belize | 25 | 37 | 24 | 28 | 48 | 38 | 39 | 36 | 34 | 53 |
|
|
||||||||||
| Dominica | 50 | 59 | 72 | 79 | 60 | 59 | 43 | 36 | 43 | 48 |
|
|
||||||||||
| Kuwait | 74 | 66 | 35 | 62 | 53 | 68 | 67 | 58 | 73 | 48 |
|
|
||||||||||
| United Arab Emirates | 41 | 31 | 42 | 37 | 33 | 37 | 86 | 60 | 54 | 46 |
|
|
||||||||||
| Angola | 268 | 295 | 184 | 106 | 76 | 62 | 61 | 39 | 70 | 45 |
|
|
||||||||||
| Estonia | 27 | 26 | 18 | 34 | 34 | 26 | 28 | 15 | 26 | 45 |
|
|
||||||||||
| Republic of Panama | 38 | 57 | 73 | 63 | 52 | 73 | 65 | 49 | 34 | 43 |
|
|
||||||||||
| Liberia | 409 | 581 | 356 | 153 | 74 | 94 | 162 | 106 | 58 | 39 |
|
|
||||||||||
| Tajikistan | 14 | 85 | 46 | 44 | 15 | 50 | 52 | 47 | 34 | 39 |
|
|
||||||||||
| Serbia and Montenegro | 29 | 441 | 693 | 792 | 456 | 204 | 109 | 39 | 32 | 34 |
|
|
||||||||||
| Gambia | 10 | 29 | 38 | 32 | 25 | 10 | 37 | 24 | 18 | 33 |
|
|
||||||||||
| Bahrain | 12 | 12 | 12 | 22 | 9 | 35 | 28 | 21 | 39 | 32 |
|
|
||||||||||
| Macao | 21 | 21 | 32 | 16 | 12 | 21 | 21 | 13 | 33 | 29 |
|
|
||||||||||
| Antigua and Barbuda | 14 | 24 | 32 | 15 | 32 | 38 | 27 | 37 | 51 | 25 |
|
|
||||||||||
| Comoros | — | 5 | 7 | 11 | — | 19 | 22 | 14 | 18 | 22 |
|
|
||||||||||
| Slovenia | 17 | 23 | 11 | 29 | 18 | 27 | 12 | 13 | 36 | 20 |
|
|
||||||||||
| St. Kitts-Nevis | 8 | 11 | — | 10 | 25 | 11 | 22 | 12 | 21 | 18 |
|
|
||||||||||
| People’s Democratic Republic of Korea | 15 | 14 | 10 | 7 | 19 | 11 | 45 | 96 | 66 | 17 |
|
|
||||||||||
| Cyprus | 11 | 7 | 9 | — | 7 | 6 | 18 | 6 | 12 | 16 |
|
|
||||||||||
| Laos | 38 | 42 | 74 | 53 | 32 | 39 | 54 | 22 | 25 | 15 |
|
|
||||||||||
| Turkmenistan | 16 | 40 | 26 | 37 | 13 | 20 | 30 | 20 | 20 | 14 |
|
|
||||||||||
| Oman | 12 | 14 | 18 | 16 | 10 | 7 | 14 | 10 | 13 | 11 |
|
|
||||||||||
| Malawi | 17 | 23 | 15 | 13 | 5 | 10 | 28 | 16 | 9 | 10 |
|
|
||||||||||
| Republic of Montenegro | 0 | 0 | 0 | 7 | 18 | 10 | 14 | 19 | 26 | 9 |
|
|
||||||||||
| Luxembourg | 9 | 10 | 9 | 9 | — | — | 8 | 11 | 6 | 7 |
|
|
||||||||||
| Yugoslavia | 733 | 329 | 138 | 99 | 95 | 48 | 46 | 17 | 12 | 7 |
|
|
||||||||||
| Seychelles | 15 | 25 | 8 | 9 | 18 | — | 10 | 10 | 6 | 5 |
|
|
||||||||||
| Country not stated | 36 | 65 | 80 | 24 | 5 | 0 | 7 | 6 | 13 | 32 |
|
|
||||||||||
| Other countries | 104 | 112 | 104 | 92 | 107 | 120 | 120 | 77 | 94 | 112 |
|
|
||||||||||
| Total | 235,823 | 262,243 | 251,640 | 236,753 | 247,245 | 252,172 | 280,688 | 248,749 | 257,895 | 258,953 |
Note: Source country is based on Country of Citizenship
Canada – Permanent residents by top source countries, 2011-2013